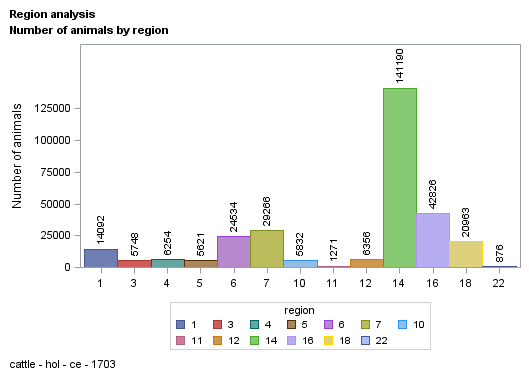
| region |
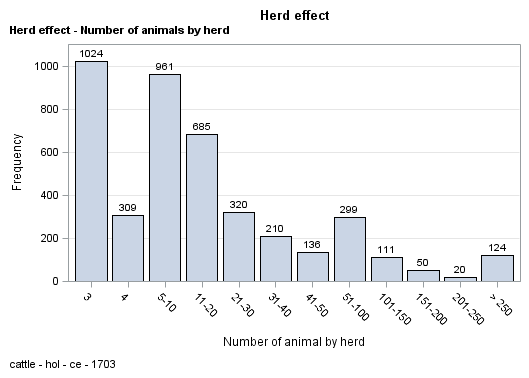
| herd |
| parity |
| calvdiff |
| stillb |
| weight |
| source |
| sex |
| birth_dt |
| birth_dt_dam |
| ycalv |
| mcalv |
| age_c |
| parity2 |
| calvdiff1 |
| calvdiff2 |
| age_c2 |
| stillb1 |
| stillb2 |
| sex1 |
| age_x |
| parity_c |
| n_hycalv |
| ycalv2 |
| varObsCE |
| varExpCE |
| varObsSB |
| varExpSB |
| meanObsCE |
| meanObsSB |
| calvdiffs |
| calvdiff1s |
| calvdiff2s |
| stillbs |
| stillb1s |
| stillb2s |
| n_hycalv1 |
| perma |
| perm2a |
| sexa |
| sexpa |
| sexpaga |
| calvsa |
| regya |
| herda |
| herdya |
| idanima |
| idsirea |
| iddama |
| y3103 |
| y3104 |
| y3105 |
| y3106 |
|
| 304829 |
| 304829 |
| 304829 |
| 304829 |
| 304829 |
| 304829 |
| 304829 |
| 304829 |
| 304829 |
| 304829 |
| 304829 |
| 304829 |
| 304829 |
| 304829 |
| 304829 |
| 304829 |
| 304829 |
| 304829 |
| 304829 |
| 304829 |
| 304829 |
| 304829 |
| 304829 |
| 304829 |
| 304829 |
| 304829 |
| 304829 |
| 304829 |
| 304829 |
| 304829 |
| 304829 |
| 304829 |
| 304829 |
| 304829 |
| 304829 |
| 304829 |
| 304829 |
| 304829 |
| 304829 |
| 304829 |
| 304829 |
| 304829 |
| 304829 |
| 304829 |
| 304829 |
| 304829 |
| 304829 |
| 302711 |
| 301544 |
| 304829 |
| 304829 |
| 304829 |
| 304829 |
|
| 11.953 |
| -1004779.461 |
| 2.302 |
| 1.596 |
| 1.045 |
| 35.791 |
| 1.353 |
| 1.543 |
| 18115.657 |
| 16732.792 |
| 2009.094 |
| 6.684 |
| 45.339 |
| 1.621 |
| 62.059 |
| 38.538 |
| 45.180 |
| 61.845 |
| 38.201 |
| 1.210 |
| 45.339 |
| 2.239 |
| 394.604 |
| 2003.844 |
| 0.258 |
| 0.305 |
| 0.043 |
| 0.037 |
| 1.596 |
| 1.045 |
| 1.596 |
| 62.060 |
| 38.537 |
| 1.045 |
| 61.844 |
| 38.201 |
| 394.490 |
| 75583.421 |
| 104946.278 |
| 1.543 |
| 2.708 |
| 89.907 |
| 181.707 |
| 133.964 |
| 2509.803 |
| 7113.176 |
| 255770.864 |
| 251091.575 |
| 202765.179 |
| 1.596 |
| 1.596 |
| 1.045 |
| 1.045 |
|
| 4.645 |
| 3948635.616 |
| 1.456 |
| 0.540 |
| 0.208 |
| 11.513 |
| 0.478 |
| 0.498 |
| 1928.420 |
| 2048.926 |
| 5.266 |
| 3.470 |
| 21.136 |
| 0.485 |
| 47.251 |
| 47.273 |
| 20.580 |
| 47.524 |
| 47.535 |
| 0.407 |
| 21.136 |
| 1.283 |
| 514.483 |
| 0.362 |
| 0.084 |
| 0.000 |
| 0.010 |
| 0.000 |
| 0.185 |
| 0.011 |
| 0.583 |
| 47.250 |
| 47.274 |
| 0.193 |
| 47.524 |
| 47.535 |
| 514.465 |
| 45605.440 |
| 63300.244 |
| 0.498 |
| 1.101 |
| 78.245 |
| 63.355 |
| 53.429 |
| 1182.155 |
| 4254.759 |
| 102356.901 |
| 199276.112 |
| 138980.019 |
| 0.540 |
| 0.540 |
| 0.208 |
| 0.208 |
|
| 1.000 |
| -21270001.00 |
| 1.000 |
| 1.000 |
| 1.000 |
| 0.000 |
| 1.000 |
| 1.000 |
| 12513.000 |
| 8705.000 |
| 1997.000 |
| 1.000 |
| 18.000 |
| 1.000 |
| 1.000 |
| 1.000 |
| 18.000 |
| 1.000 |
| 1.000 |
| 1.000 |
| 18.000 |
| 1.000 |
| 3.000 |
| 2003.000 |
| 0.008 |
| 0.305 |
| 0.016 |
| 0.037 |
| 1.317 |
| 1.017 |
| -4.175 |
| -4.175 |
| -4.175 |
| 0.992 |
| 0.992 |
| 0.992 |
| 3.000 |
| 1.000 |
| 1.000 |
| 1.000 |
| 1.000 |
| 1.000 |
| 1.000 |
| 1.000 |
| 1.000 |
| 1.000 |
| 58396.000 |
| 3.000 |
| 4.000 |
| 1.000 |
| 1.000 |
| 1.000 |
| 1.000 |
|
| 22.000 |
| 186351.000 |
| 10.000 |
| 4.000 |
| 2.000 |
| 98.000 |
| 2.000 |
| 2.000 |
| 21094.000 |
| 20497.000 |
| 2017.000 |
| 12.000 |
| 162.000 |
| 2.000 |
| 99.000 |
| 99.000 |
| 108.000 |
| 99.000 |
| 99.000 |
| 2.000 |
| 162.000 |
| 5.000 |
| 2200.000 |
| 2004.000 |
| 0.346 |
| 0.305 |
| 0.089 |
| 0.037 |
| 2.020 |
| 1.099 |
| 6.275 |
| 99.000 |
| 99.000 |
| 2.504 |
| 99.000 |
| 99.000 |
| 2200.000 |
| 155803.000 |
| 216828.000 |
| 2.000 |
| 4.000 |
| 229.000 |
| 280.000 |
| 228.000 |
| 4249.000 |
| 15564.000 |
| 450627.000 |
| 454442.000 |
| 453012.000 |
| 4.000 |
| 4.000 |
| 2.000 |
| 2.000 |
|