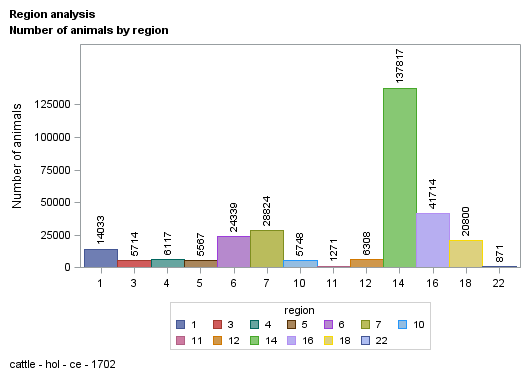
| region |
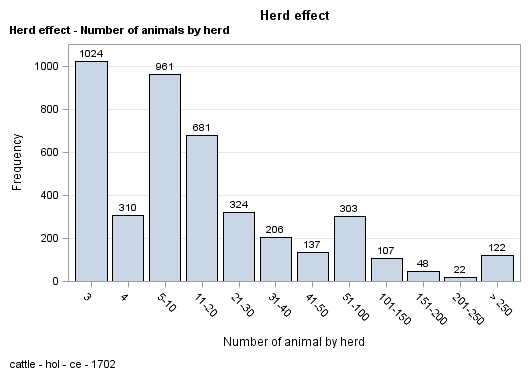
| herd |
| parity |
| calvdiff |
| stillb |
| weight |
| source |
| sex |
| birth_dt |
| birth_dt_dam |
| ycalv |
| mcalv |
| age_c |
| parity2 |
| calvdiff1 |
| calvdiff2 |
| age_c2 |
| stillb1 |
| stillb2 |
| sex1 |
| age_x |
| parity_c |
| n_hycalv |
| ycalv2 |
| varObsCE |
| varExpCE |
| varObsSB |
| varExpSB |
| meanObsCE |
| meanObsSB |
| calvdiffs |
| calvdiff1s |
| calvdiff2s |
| stillbs |
| stillb1s |
| stillb2s |
| n_hycalv1 |
| perma |
| perm2a |
| sexa |
| sexpa |
| sexpaga |
| calvsa |
| regya |
| herda |
| herdya |
| idanima |
| idsirea |
| iddama |
| y3103 |
| y3104 |
| y3105 |
| y3106 |
|
| 299123 |
| 299123 |
| 299123 |
| 299123 |
| 299123 |
| 299123 |
| 299123 |
| 299123 |
| 299123 |
| 299123 |
| 299123 |
| 299123 |
| 299123 |
| 299123 |
| 299123 |
| 299123 |
| 299123 |
| 299123 |
| 299123 |
| 299123 |
| 299123 |
| 299123 |
| 299123 |
| 299123 |
| 299123 |
| 299123 |
| 299123 |
| 299123 |
| 299123 |
| 299123 |
| 299123 |
| 299123 |
| 299123 |
| 299123 |
| 299123 |
| 299123 |
| 299123 |
| 299123 |
| 299123 |
| 299123 |
| 299123 |
| 299123 |
| 299123 |
| 299123 |
| 299123 |
| 299123 |
| 299123 |
| 296996 |
| 295847 |
| 299123 |
| 299123 |
| 299123 |
| 299123 |
|
| 11.931 |
| -1025423.635 |
| 2.302 |
| 1.596 |
| 1.046 |
| 35.803 |
| 1.340 |
| 1.544 |
| 18058.896 |
| 16675.122 |
| 2008.940 |
| 6.661 |
| 45.369 |
| 1.621 |
| 62.050 |
| 38.546 |
| 45.209 |
| 61.837 |
| 38.209 |
| 1.210 |
| 45.369 |
| 2.239 |
| 383.042 |
| 2003.842 |
| 0.257 |
| 0.305 |
| 0.044 |
| 0.038 |
| 1.596 |
| 1.046 |
| 1.596 |
| 62.051 |
| 38.545 |
| 1.046 |
| 61.836 |
| 38.210 |
| 382.926 |
| 74345.305 |
| 103103.320 |
| 1.544 |
| 2.708 |
| 89.935 |
| 179.842 |
| 133.561 |
| 2500.962 |
| 7110.818 |
| 251863.742 |
| 247085.565 |
| 199297.867 |
| 1.596 |
| 1.596 |
| 1.046 |
| 1.046 |
|
| 4.661 |
| 3983379.712 |
| 1.457 |
| 0.541 |
| 0.210 |
| 11.482 |
| 0.474 |
| 0.498 |
| 1902.689 |
| 2023.644 |
| 5.198 |
| 3.497 |
| 21.141 |
| 0.485 |
| 47.254 |
| 47.276 |
| 20.580 |
| 47.525 |
| 47.537 |
| 0.407 |
| 21.141 |
| 1.283 |
| 506.351 |
| 0.365 |
| 0.085 |
| 0.000 |
| 0.010 |
| 0.000 |
| 0.188 |
| 0.011 |
| 0.584 |
| 47.253 |
| 47.277 |
| 0.196 |
| 47.526 |
| 47.537 |
| 506.329 |
| 44940.534 |
| 62191.515 |
| 0.498 |
| 1.102 |
| 78.251 |
| 62.509 |
| 53.573 |
| 1182.470 |
| 4250.200 |
| 100742.124 |
| 195977.803 |
| 136975.146 |
| 0.541 |
| 0.541 |
| 0.210 |
| 0.210 |
|
| 1.000 |
| -21270001.00 |
| 1.000 |
| 1.000 |
| 1.000 |
| 0.000 |
| 1.000 |
| 1.000 |
| 12513.000 |
| 8705.000 |
| 1997.000 |
| 1.000 |
| 18.000 |
| 1.000 |
| 1.000 |
| 1.000 |
| 18.000 |
| 1.000 |
| 1.000 |
| 1.000 |
| 18.000 |
| 1.000 |
| 3.000 |
| 2003.000 |
| 0.008 |
| 0.305 |
| 0.016 |
| 0.038 |
| 1.314 |
| 1.017 |
| -4.179 |
| -4.179 |
| -4.179 |
| 0.991 |
| 0.991 |
| 0.991 |
| 3.000 |
| 1.000 |
| 1.000 |
| 1.000 |
| 1.000 |
| 1.000 |
| 1.000 |
| 1.000 |
| 1.000 |
| 1.000 |
| 57550.000 |
| 3.000 |
| 4.000 |
| 1.000 |
| 1.000 |
| 1.000 |
| 1.000 |
|
| 22.000 |
| 186021.000 |
| 10.000 |
| 4.000 |
| 2.000 |
| 98.000 |
| 2.000 |
| 2.000 |
| 21003.000 |
| 20409.000 |
| 2017.000 |
| 12.000 |
| 162.000 |
| 2.000 |
| 99.000 |
| 99.000 |
| 108.000 |
| 99.000 |
| 99.000 |
| 2.000 |
| 162.000 |
| 5.000 |
| 2201.000 |
| 2004.000 |
| 0.346 |
| 0.305 |
| 0.090 |
| 0.038 |
| 2.020 |
| 1.100 |
| 6.278 |
| 99.000 |
| 99.000 |
| 2.526 |
| 99.000 |
| 99.000 |
| 2201.000 |
| 153482.000 |
| 213083.000 |
| 2.000 |
| 4.000 |
| 229.000 |
| 277.000 |
| 228.000 |
| 4245.000 |
| 15518.000 |
| 443748.000 |
| 447594.000 |
| 446200.000 |
| 4.000 |
| 4.000 |
| 2.000 |
| 2.000 |
|