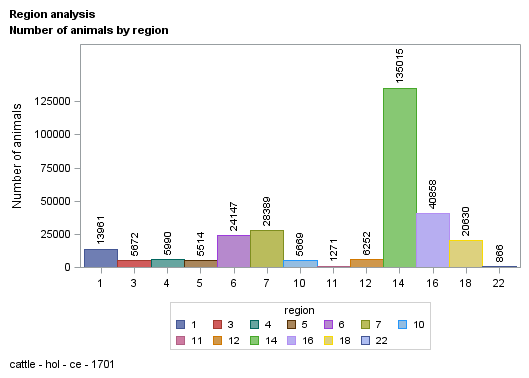
| region |
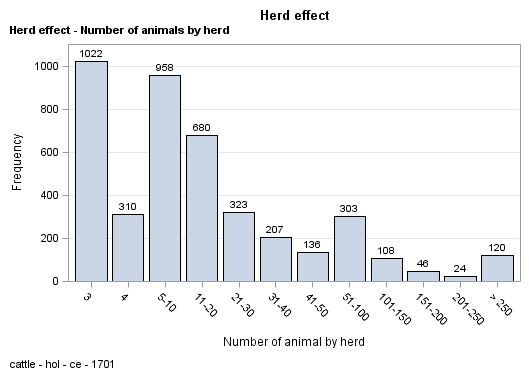
| herd |
| parity |
| calvdiff |
| stillb |
| weight |
| source |
| sex |
| birth_dt |
| birth_dt_dam |
| ycalv |
| mcalv |
| age_c |
| parity2 |
| calvdiff1 |
| calvdiff2 |
| age_c2 |
| stillb1 |
| stillb2 |
| sex1 |
| age_x |
| parity_c |
| n_hycalv |
| ycalv2 |
| varObsCE |
| varExpCE |
| varObsSB |
| varExpSB |
| meanObsCE |
| meanObsSB |
| calvdiffs |
| calvdiff1s |
| calvdiff2s |
| stillbs |
| stillb1s |
| stillb2s |
| n_hycalv1 |
| perma |
| perm2a |
| sexa |
| sexpa |
| sexpaga |
| calvsa |
| regya |
| herda |
| herdya |
| idanima |
| idsirea |
| iddama |
| y3103 |
| y3104 |
| y3105 |
| y3106 |
|
| 294234 |
| 294234 |
| 294234 |
| 294234 |
| 294234 |
| 294234 |
| 294234 |
| 294234 |
| 294234 |
| 294234 |
| 294234 |
| 294234 |
| 294234 |
| 294234 |
| 294234 |
| 294234 |
| 294234 |
| 294234 |
| 294234 |
| 294234 |
| 294234 |
| 294234 |
| 294234 |
| 294234 |
| 294234 |
| 294234 |
| 294234 |
| 294234 |
| 294234 |
| 294234 |
| 294234 |
| 294234 |
| 294234 |
| 294234 |
| 294234 |
| 294234 |
| 294234 |
| 294234 |
| 294234 |
| 294234 |
| 294234 |
| 294234 |
| 294234 |
| 294234 |
| 294234 |
| 294234 |
| 294234 |
| 292092 |
| 290955 |
| 294234 |
| 294234 |
| 294234 |
| 294234 |
|
| 11.916 |
| -1043736.593 |
| 2.303 |
| 1.594 |
| 1.047 |
| 35.824 |
| 1.328 |
| 1.545 |
| 18008.997 |
| 16623.860 |
| 2008.801 |
| 6.698 |
| 45.414 |
| 1.621 |
| 62.094 |
| 38.500 |
| 45.252 |
| 61.882 |
| 38.165 |
| 1.210 |
| 45.414 |
| 2.240 |
| 382.256 |
| 2003.839 |
| 0.256 |
| 0.305 |
| 0.045 |
| 0.039 |
| 1.594 |
| 1.047 |
| 1.594 |
| 62.095 |
| 38.500 |
| 1.047 |
| 61.882 |
| 38.165 |
| 382.138 |
| 73326.313 |
| 101556.634 |
| 1.545 |
| 2.710 |
| 89.954 |
| 178.202 |
| 133.249 |
| 2495.086 |
| 7082.740 |
| 248955.492 |
| 243607.477 |
| 196633.538 |
| 1.594 |
| 1.594 |
| 1.047 |
| 1.047 |
|
| 4.673 |
| 4014026.383 |
| 1.458 |
| 0.541 |
| 0.211 |
| 11.443 |
| 0.470 |
| 0.498 |
| 1879.797 |
| 2000.298 |
| 5.130 |
| 3.512 |
| 21.147 |
| 0.485 |
| 47.244 |
| 47.265 |
| 20.580 |
| 47.514 |
| 47.525 |
| 0.407 |
| 21.147 |
| 1.284 |
| 509.593 |
| 0.368 |
| 0.085 |
| 0.000 |
| 0.010 |
| 0.000 |
| 0.191 |
| 0.012 |
| 0.585 |
| 47.243 |
| 47.266 |
| 0.198 |
| 47.514 |
| 47.525 |
| 509.570 |
| 44289.163 |
| 61179.608 |
| 0.498 |
| 1.102 |
| 78.223 |
| 61.757 |
| 53.677 |
| 1183.413 |
| 4232.624 |
| 99332.731 |
| 193334.978 |
| 135404.788 |
| 0.541 |
| 0.541 |
| 0.211 |
| 0.211 |
|
| 1.000 |
| -21270001.00 |
| 1.000 |
| 1.000 |
| 1.000 |
| 0.000 |
| 1.000 |
| 1.000 |
| 12513.000 |
| 8705.000 |
| 1997.000 |
| 1.000 |
| 18.000 |
| 1.000 |
| 1.000 |
| 1.000 |
| 18.000 |
| 1.000 |
| 1.000 |
| 1.000 |
| 18.000 |
| 1.000 |
| 3.000 |
| 2003.000 |
| 0.008 |
| 0.305 |
| 0.016 |
| 0.039 |
| 1.312 |
| 1.017 |
| -4.179 |
| -4.179 |
| -4.179 |
| 0.991 |
| 0.991 |
| 0.991 |
| 3.000 |
| 1.000 |
| 1.000 |
| 1.000 |
| 1.000 |
| 1.000 |
| 1.000 |
| 1.000 |
| 1.000 |
| 1.000 |
| 57302.000 |
| 3.000 |
| 4.000 |
| 1.000 |
| 1.000 |
| 1.000 |
| 1.000 |
|
| 22.000 |
| 184991.000 |
| 10.000 |
| 4.000 |
| 2.000 |
| 98.000 |
| 2.000 |
| 2.000 |
| 20885.000 |
| 20276.000 |
| 2017.000 |
| 12.000 |
| 162.000 |
| 2.000 |
| 99.000 |
| 99.000 |
| 108.000 |
| 99.000 |
| 99.000 |
| 2.000 |
| 162.000 |
| 5.000 |
| 2201.000 |
| 2004.000 |
| 0.348 |
| 0.305 |
| 0.090 |
| 0.039 |
| 2.020 |
| 1.100 |
| 6.278 |
| 99.000 |
| 99.000 |
| 2.544 |
| 99.000 |
| 99.000 |
| 2201.000 |
| 151329.000 |
| 209730.000 |
| 2.000 |
| 4.000 |
| 229.000 |
| 273.000 |
| 227.000 |
| 4237.000 |
| 15437.000 |
| 438227.000 |
| 442255.000 |
| 440896.000 |
| 4.000 |
| 4.000 |
| 2.000 |
| 2.000 |
|