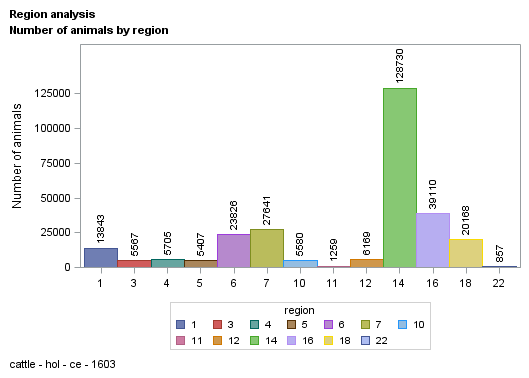
| region |
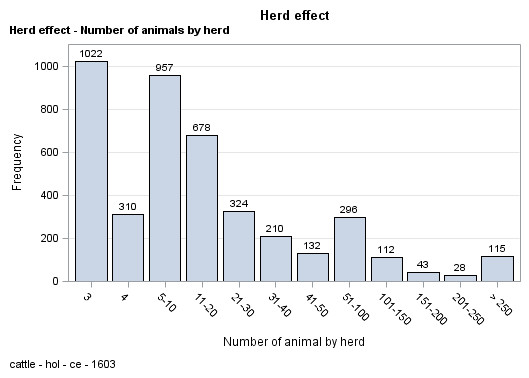
| herd |
| parity |
| calvdiff |
| stillb |
| weight |
| source |
| sex |
| birth_dt |
| birth_dt_dam |
| ycalv |
| mcalv |
| age_c |
| parity2 |
| calvdiff1 |
| calvdiff2 |
| age_c2 |
| stillb1 |
| stillb2 |
| sex1 |
| age_x |
| parity_c |
| n_hycalv |
| ycalv2 |
| varObsCE |
| varExpCE |
| varObsSB |
| varExpSB |
| meanObsCE |
| meanObsSB |
| calvdiffs |
| calvdiff1s |
| calvdiff2s |
| stillbs |
| stillb1s |
| stillb2s |
| n_hycalv1 |
| perma |
| perm2a |
| sexa |
| sexpa |
| sexpaga |
| calvsa |
| regya |
| herda |
| herdya |
| idanima |
| idsirea |
| iddama |
| y3103 |
| y3104 |
| y3105 |
| y3106 |
|
| 283862 |
| 283862 |
| 283862 |
| 283862 |
| 283862 |
| 283862 |
| 283862 |
| 283862 |
| 283862 |
| 283862 |
| 283862 |
| 283862 |
| 283862 |
| 283862 |
| 283862 |
| 283862 |
| 283862 |
| 283862 |
| 283862 |
| 283862 |
| 283862 |
| 283862 |
| 283862 |
| 283862 |
| 283862 |
| 283862 |
| 283862 |
| 283862 |
| 283862 |
| 283862 |
| 283862 |
| 283862 |
| 283862 |
| 283862 |
| 283862 |
| 283862 |
| 283862 |
| 283862 |
| 283862 |
| 283862 |
| 283862 |
| 283862 |
| 283862 |
| 283862 |
| 283862 |
| 283862 |
| 283862 |
| 281708 |
| 280589 |
| 283862 |
| 283862 |
| 283862 |
| 283862 |
|
| 11.873 |
| -1084419.512 |
| 2.301 |
| 1.593 |
| 1.049 |
| 35.865 |
| 1.304 |
| 1.546 |
| 17906.795 |
| 16521.056 |
| 2008.524 |
| 6.661 |
| 45.434 |
| 1.620 |
| 61.972 |
| 38.620 |
| 45.270 |
| 61.761 |
| 38.287 |
| 1.210 |
| 45.434 |
| 2.238 |
| 361.094 |
| 2003.833 |
| 0.255 |
| 0.306 |
| 0.046 |
| 0.042 |
| 1.593 |
| 1.049 |
| 1.593 |
| 61.973 |
| 38.619 |
| 1.049 |
| 61.761 |
| 38.288 |
| 360.971 |
| 71347.080 |
| 98493.243 |
| 1.546 |
| 2.712 |
| 90.111 |
| 174.846 |
| 125.631 |
| 2478.622 |
| 7034.963 |
| 242980.252 |
| 237098.951 |
| 190890.145 |
| 1.593 |
| 1.593 |
| 1.049 |
| 1.049 |
|
| 4.702 |
| 4080939.015 |
| 1.460 |
| 0.543 |
| 0.215 |
| 11.382 |
| 0.460 |
| 0.498 |
| 1835.112 |
| 1957.970 |
| 5.012 |
| 3.468 |
| 21.154 |
| 0.485 |
| 47.275 |
| 47.296 |
| 20.581 |
| 47.543 |
| 47.555 |
| 0.408 |
| 21.154 |
| 1.284 |
| 480.093 |
| 0.373 |
| 0.086 |
| 0.000 |
| 0.010 |
| 0.000 |
| 0.198 |
| 0.012 |
| 0.588 |
| 47.274 |
| 47.297 |
| 0.204 |
| 47.543 |
| 47.555 |
| 480.063 |
| 43058.753 |
| 59202.672 |
| 0.498 |
| 1.103 |
| 78.292 |
| 60.291 |
| 51.347 |
| 1184.850 |
| 4203.264 |
| 96387.928 |
| 187645.604 |
| 131789.364 |
| 0.543 |
| 0.543 |
| 0.215 |
| 0.215 |
|
| 1.000 |
| -21270001.00 |
| 1.000 |
| 1.000 |
| 1.000 |
| 0.000 |
| 1.000 |
| 1.000 |
| 12513.000 |
| 8705.000 |
| 1997.000 |
| 1.000 |
| 18.000 |
| 1.000 |
| 1.000 |
| 1.000 |
| 18.000 |
| 1.000 |
| 1.000 |
| 1.000 |
| 18.000 |
| 1.000 |
| 3.000 |
| 2003.000 |
| 0.008 |
| 0.306 |
| 0.016 |
| 0.042 |
| 1.300 |
| 1.017 |
| -4.187 |
| -4.187 |
| -4.187 |
| 0.990 |
| 0.990 |
| 0.990 |
| 3.000 |
| 1.000 |
| 1.000 |
| 1.000 |
| 1.000 |
| 1.000 |
| 1.000 |
| 1.000 |
| 1.000 |
| 1.000 |
| 56937.000 |
| 3.000 |
| 4.000 |
| 1.000 |
| 1.000 |
| 1.000 |
| 1.000 |
|
| 22.000 |
| 182681.000 |
| 10.000 |
| 4.000 |
| 2.000 |
| 98.000 |
| 2.000 |
| 2.000 |
| 20718.000 |
| 20119.000 |
| 2016.000 |
| 12.000 |
| 162.000 |
| 2.000 |
| 99.000 |
| 99.000 |
| 108.000 |
| 99.000 |
| 99.000 |
| 2.000 |
| 162.000 |
| 5.000 |
| 2201.000 |
| 2004.000 |
| 0.350 |
| 0.306 |
| 0.092 |
| 0.042 |
| 2.020 |
| 1.102 |
| 6.283 |
| 99.000 |
| 99.000 |
| 2.589 |
| 99.000 |
| 99.000 |
| 2201.000 |
| 147375.000 |
| 203176.000 |
| 2.000 |
| 4.000 |
| 229.000 |
| 267.000 |
| 216.000 |
| 4227.000 |
| 15280.000 |
| 426892.000 |
| 430943.000 |
| 429630.000 |
| 4.000 |
| 4.000 |
| 2.000 |
| 2.000 |
|