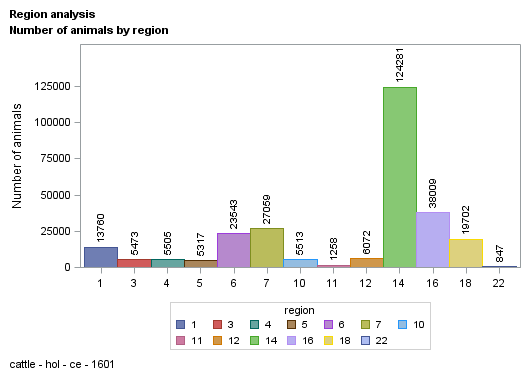
| region |
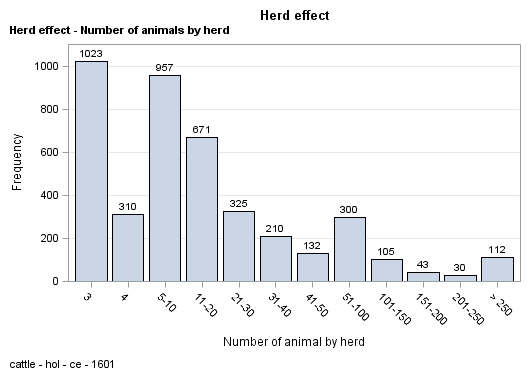
| herd |
| parity |
| calvdiff |
| stillb |
| weight |
| source |
| sex |
| birth_dt |
| birth_dt_dam |
| ycalv |
| mcalv |
| age_c |
| parity2 |
| calvdiff1 |
| calvdiff2 |
| age_c2 |
| stillb1 |
| stillb2 |
| sex1 |
| age_x |
| parity_c |
| n_hycalv |
| ycalv2 |
| varObsCE |
| varExpCE |
| varObsSB |
| varExpSB |
| meanObsCE |
| meanObsSB |
| calvdiffs |
| calvdiff1s |
| calvdiff2s |
| stillbs |
| stillb1s |
| stillb2s |
| n_hycalv1 |
| perma |
| perm2a |
| sexa |
| sexpa |
| sexpaga |
| calvsa |
| regya |
| herda |
| herdya |
| idanima |
| idsirea |
| iddama |
| y3103 |
| y3104 |
| y3105 |
| y3106 |
|
| 276339 |
| 276339 |
| 276339 |
| 276339 |
| 276339 |
| 276339 |
| 276339 |
| 276339 |
| 276339 |
| 276339 |
| 276339 |
| 276339 |
| 276339 |
| 276339 |
| 276339 |
| 276339 |
| 276339 |
| 276339 |
| 276339 |
| 276339 |
| 276339 |
| 276339 |
| 276339 |
| 276339 |
| 276339 |
| 276339 |
| 276339 |
| 276339 |
| 276339 |
| 276339 |
| 276339 |
| 276339 |
| 276339 |
| 276339 |
| 276339 |
| 276339 |
| 276339 |
| 276339 |
| 276339 |
| 276339 |
| 276339 |
| 276339 |
| 276339 |
| 276339 |
| 276339 |
| 276339 |
| 276339 |
| 274203 |
| 273070 |
| 276339 |
| 276339 |
| 276339 |
| 276339 |
|
| 11.843 |
| -1115713.187 |
| 2.299 |
| 1.594 |
| 1.050 |
| 35.893 |
| 1.285 |
| 1.547 |
| 17833.484 |
| 16448.185 |
| 2008.325 |
| 6.643 |
| 45.419 |
| 1.619 |
| 61.887 |
| 38.708 |
| 45.255 |
| 61.675 |
| 38.375 |
| 1.211 |
| 45.419 |
| 2.235 |
| 348.903 |
| 2003.828 |
| 0.255 |
| 0.307 |
| 0.047 |
| 0.043 |
| 1.594 |
| 1.050 |
| 1.594 |
| 61.888 |
| 38.707 |
| 1.050 |
| 61.675 |
| 38.375 |
| 348.777 |
| 69910.903 |
| 96301.084 |
| 1.547 |
| 2.713 |
| 90.144 |
| 172.437 |
| 125.102 |
| 2467.061 |
| 7004.396 |
| 238467.218 |
| 232332.534 |
| 186616.219 |
| 1.594 |
| 1.594 |
| 1.050 |
| 1.050 |
|
| 4.722 |
| 4131635.629 |
| 1.460 |
| 0.543 |
| 0.218 |
| 11.333 |
| 0.452 |
| 0.498 |
| 1803.704 |
| 1929.607 |
| 4.928 |
| 3.507 |
| 21.137 |
| 0.486 |
| 47.295 |
| 47.316 |
| 20.563 |
| 47.563 |
| 47.576 |
| 0.408 |
| 21.137 |
| 1.283 |
| 473.201 |
| 0.377 |
| 0.087 |
| 0.000 |
| 0.011 |
| 0.000 |
| 0.201 |
| 0.012 |
| 0.590 |
| 47.294 |
| 47.317 |
| 0.208 |
| 47.564 |
| 47.575 |
| 473.166 |
| 42177.249 |
| 57804.934 |
| 0.498 |
| 1.103 |
| 78.332 |
| 59.259 |
| 51.502 |
| 1186.434 |
| 4185.671 |
| 94247.885 |
| 183464.550 |
| 129098.625 |
| 0.543 |
| 0.543 |
| 0.218 |
| 0.218 |
|
| 1.000 |
| -21270001.00 |
| 1.000 |
| 1.000 |
| 1.000 |
| 0.000 |
| 1.000 |
| 1.000 |
| 12513.000 |
| 8705.000 |
| 1997.000 |
| 1.000 |
| 18.000 |
| 1.000 |
| 1.000 |
| 1.000 |
| 18.000 |
| 1.000 |
| 1.000 |
| 1.000 |
| 18.000 |
| 1.000 |
| 3.000 |
| 2003.000 |
| 0.008 |
| 0.307 |
| 0.016 |
| 0.043 |
| 1.296 |
| 1.017 |
| -4.196 |
| -4.196 |
| -4.196 |
| 0.990 |
| 0.990 |
| 0.990 |
| 3.000 |
| 1.000 |
| 1.000 |
| 1.000 |
| 1.000 |
| 1.000 |
| 1.000 |
| 1.000 |
| 1.000 |
| 1.000 |
| 56513.000 |
| 2.000 |
| 3.000 |
| 1.000 |
| 1.000 |
| 1.000 |
| 1.000 |
|
| 22.000 |
| 181057.000 |
| 10.000 |
| 4.000 |
| 2.000 |
| 98.000 |
| 2.000 |
| 2.000 |
| 20611.000 |
| 19997.000 |
| 2016.000 |
| 12.000 |
| 162.000 |
| 2.000 |
| 99.000 |
| 99.000 |
| 108.000 |
| 99.000 |
| 99.000 |
| 2.000 |
| 162.000 |
| 5.000 |
| 2201.000 |
| 2004.000 |
| 0.351 |
| 0.307 |
| 0.093 |
| 0.043 |
| 2.020 |
| 1.104 |
| 6.290 |
| 99.000 |
| 99.000 |
| 2.621 |
| 99.000 |
| 99.000 |
| 2201.000 |
| 144505.000 |
| 198579.000 |
| 2.000 |
| 4.000 |
| 229.000 |
| 264.000 |
| 216.000 |
| 4218.000 |
| 15188.000 |
| 418498.000 |
| 422424.000 |
| 421123.000 |
| 4.000 |
| 4.000 |
| 2.000 |
| 2.000 |
|