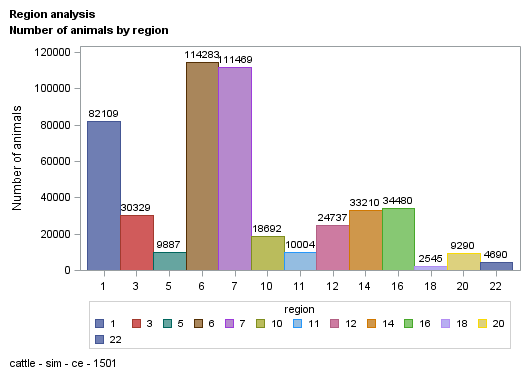
| region |
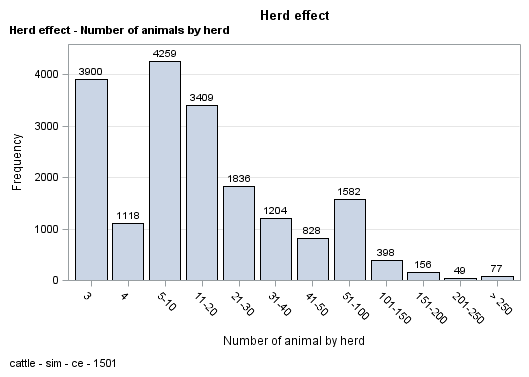
| herd |
| parity |
| calvdiff |
| stillb |
| weight |
| source |
| sex |
| birth_dt |
| birth_dt_dam |
| ycalv |
| mcalv |
| age_c |
| parity2 |
| calvdiff1 |
| calvdiff2 |
| age_c2 |
| stillb1 |
| stillb2 |
| sex1 |
| age_x |
| parity_c |
| n_hycalv |
| ycalv2 |
| varObsCE |
| varExpCE |
| varObsSB |
| varExpSB |
| meanObsCE |
| meanObsSB |
| calvdiffs |
| calvdiff1s |
| calvdiff2s |
| stillbs |
| stillb1s |
| stillb2s |
| n_hycalv1 |
| perma |
| perm2a |
| sexa |
| sexpa |
| sexpaga |
| calvsa |
| regya |
| herda |
| herdya |
| idanima |
| idsirea |
| iddama |
| y3103 |
| y3104 |
| y3105 |
| y3106 |
|
| 485725 |
| 485725 |
| 485725 |
| 485725 |
| 485725 |
| 485725 |
| 485725 |
| 485725 |
| 485725 |
| 485725 |
| 485725 |
| 485725 |
| 485725 |
| 485725 |
| 485725 |
| 485725 |
| 485725 |
| 485725 |
| 485725 |
| 485725 |
| 485725 |
| 485725 |
| 485725 |
| 485725 |
| 485725 |
| 485725 |
| 485725 |
| 485725 |
| 485725 |
| 485725 |
| 485725 |
| 485725 |
| 485725 |
| 485725 |
| 485725 |
| 485725 |
| 485725 |
| 485725 |
| 485725 |
| 485725 |
| 485725 |
| 485725 |
| 485725 |
| 485725 |
| 485725 |
| 485725 |
| 485725 |
| 484926 |
| 473685 |
| 485725 |
| 485725 |
| 485725 |
| 485725 |
|
| 7.481 |
| -2177437.023 |
| 3.241 |
| 1.773 |
| 1.025 |
| 40.451 |
| 1.077 |
| 1.589 |
| 16745.908 |
| 15014.751 |
| 2005.345 |
| 6.597 |
| 56.760 |
| 1.759 |
| 75.591 |
| 25.182 |
| 55.758 |
| 75.409 |
| 24.616 |
| 1.139 |
| 50.848 |
| 3.212 |
| 131.774 |
| 2003.659 |
| 0.173 |
| 0.148 |
| 0.024 |
| 0.028 |
| 1.773 |
| 1.025 |
| 1.773 |
| 75.592 |
| 25.182 |
| 1.025 |
| 75.409 |
| 24.616 |
| 131.457 |
| 101932.785 |
| 136817.909 |
| 1.589 |
| 2.937 |
| 106.911 |
| 141.715 |
| 81.188 |
| 9238.345 |
| 40443.513 |
| 370810.233 |
| 92266.433 |
| 272859.586 |
| 1.773 |
| 1.773 |
| 1.025 |
| 1.025 |
|
| 4.925 |
| 5622418.888 |
| 2.089 |
| 0.455 |
| 0.156 |
| 10.206 |
| 0.267 |
| 0.492 |
| 1724.423 |
| 1900.514 |
| 4.718 |
| 3.440 |
| 28.181 |
| 0.428 |
| 41.562 |
| 41.579 |
| 25.802 |
| 41.885 |
| 41.896 |
| 0.346 |
| 26.012 |
| 2.011 |
| 635.812 |
| 0.474 |
| 0.073 |
| 0.000 |
| 0.007 |
| 0.000 |
| 0.184 |
| 0.008 |
| 0.427 |
| 41.561 |
| 41.578 |
| 0.169 |
| 41.885 |
| 41.896 |
| 635.200 |
| 62315.668 |
| 81463.005 |
| 0.492 |
| 1.079 |
| 84.098 |
| 56.651 |
| 51.272 |
| 4930.004 |
| 23678.588 |
| 186333.624 |
| 136778.941 |
| 178595.428 |
| 0.455 |
| 0.455 |
| 0.156 |
| 0.156 |
|
| 1.000 |
| -99100229.00 |
| 1.000 |
| 1.000 |
| 1.000 |
| 0.000 |
| 1.000 |
| 1.000 |
| 12452.000 |
| 7716.000 |
| 1995.000 |
| 1.000 |
| 18.000 |
| 1.000 |
| 1.000 |
| 1.000 |
| 18.000 |
| 1.000 |
| 1.000 |
| 1.000 |
| 0.000 |
| 1.000 |
| 3.000 |
| 2003.000 |
| 0.045 |
| 0.148 |
| 0.008 |
| 0.028 |
| 1.244 |
| 1.008 |
| 0.199 |
| 0.199 |
| 0.199 |
| 0.993 |
| 0.993 |
| 0.993 |
| 3.000 |
| 1.000 |
| 1.000 |
| 1.000 |
| 1.000 |
| 1.000 |
| 1.000 |
| 1.000 |
| 1.000 |
| 1.000 |
| 27148.000 |
| 7.000 |
| 3.000 |
| 1.000 |
| 1.000 |
| 1.000 |
| 1.000 |
|
| 22.000 |
| 177162.000 |
| 10.000 |
| 4.000 |
| 2.000 |
| 99.000 |
| 2.000 |
| 2.000 |
| 20174.000 |
| 19552.000 |
| 2015.000 |
| 12.000 |
| 162.000 |
| 2.000 |
| 99.000 |
| 99.000 |
| 108.000 |
| 99.000 |
| 99.000 |
| 2.000 |
| 132.000 |
| 8.000 |
| 4651.000 |
| 2004.000 |
| 0.263 |
| 0.148 |
| 0.040 |
| 0.028 |
| 2.031 |
| 1.042 |
| 5.654 |
| 99.000 |
| 99.000 |
| 2.941 |
| 99.000 |
| 99.000 |
| 4649.000 |
| 221017.000 |
| 291109.000 |
| 2.000 |
| 4.000 |
| 260.000 |
| 254.000 |
| 221.000 |
| 18816.000 |
| 80931.000 |
| 670307.000 |
| 670739.000 |
| 665799.000 |
| 4.000 |
| 4.000 |
| 2.000 |
| 2.000 |
|