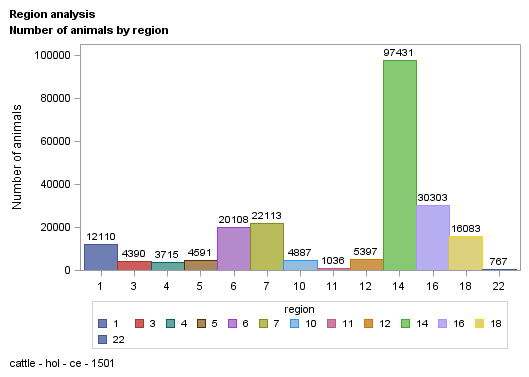
| region |
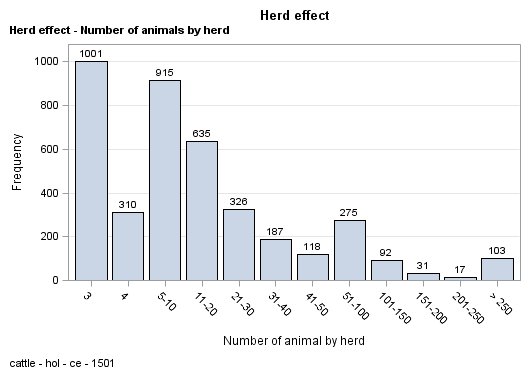
| herd |
| parity |
| calvdiff |
| stillb |
| weight |
| source |
| sex |
| birth_dt |
| birth_dt_dam |
| ycalv |
| mcalv |
| age_c |
| parity2 |
| calvdiff1 |
| calvdiff2 |
| age_c2 |
| stillb1 |
| stillb2 |
| sex1 |
| age_x |
| parity_c |
| n_hycalv |
| ycalv2 |
| varObsCE |
| varExpCE |
| varObsSB |
| varExpSB |
| meanObsCE |
| meanObsSB |
| calvdiffs |
| calvdiff1s |
| calvdiff2s |
| stillbs |
| stillb1s |
| stillb2s |
| n_hycalv1 |
| perma |
| perm2a |
| sexa |
| sexpa |
| sexpaga |
| calvsa |
| regya |
| herda |
| herdya |
| idanima |
| idsirea |
| iddama |
| y3103 |
| y3104 |
| y3105 |
| y3106 |
|
| 222931 |
| 222931 |
| 222931 |
| 222931 |
| 222931 |
| 222931 |
| 222931 |
| 222931 |
| 222931 |
| 222931 |
| 222931 |
| 222931 |
| 222931 |
| 222931 |
| 222931 |
| 222931 |
| 222931 |
| 222931 |
| 222931 |
| 222931 |
| 222931 |
| 222931 |
| 222931 |
| 222931 |
| 222931 |
| 222931 |
| 222931 |
| 222931 |
| 222931 |
| 222931 |
| 222931 |
| 222931 |
| 222931 |
| 222931 |
| 222931 |
| 222931 |
| 222931 |
| 222931 |
| 222931 |
| 222931 |
| 222931 |
| 222931 |
| 222931 |
| 222931 |
| 222931 |
| 222931 |
| 222931 |
| 220294 |
| 219033 |
| 222931 |
| 222931 |
| 222931 |
| 222931 |
|
| 11.747 |
| -1312313.206 |
| 2.313 |
| 1.597 |
| 1.057 |
| 36.023 |
| 1.160 |
| 1.553 |
| 17483.834 |
| 16090.394 |
| 2007.362 |
| 6.717 |
| 45.686 |
| 1.620 |
| 62.008 |
| 38.589 |
| 45.521 |
| 61.801 |
| 38.256 |
| 1.211 |
| 45.686 |
| 2.247 |
| 261.878 |
| 2003.811 |
| 0.253 |
| 0.314 |
| 0.053 |
| 0.053 |
| 1.597 |
| 1.057 |
| 1.597 |
| 62.009 |
| 38.588 |
| 1.057 |
| 61.801 |
| 38.256 |
| 261.742 |
| 60927.056 |
| 80197.027 |
| 1.553 |
| 2.725 |
| 90.728 |
| 160.949 |
| 115.011 |
| 2308.457 |
| 6345.912 |
| 199892.294 |
| 185034.324 |
| 157359.152 |
| 1.597 |
| 1.597 |
| 1.057 |
| 1.057 |
|
| 4.782 |
| 4430310.891 |
| 1.471 |
| 0.549 |
| 0.231 |
| 11.154 |
| 0.367 |
| 0.497 |
| 1612.690 |
| 1738.909 |
| 4.399 |
| 3.486 |
| 21.134 |
| 0.485 |
| 47.266 |
| 47.283 |
| 20.560 |
| 47.529 |
| 47.543 |
| 0.408 |
| 21.134 |
| 1.290 |
| 356.495 |
| 0.392 |
| 0.092 |
| 0.000 |
| 0.012 |
| 0.000 |
| 0.219 |
| 0.014 |
| 0.601 |
| 47.265 |
| 47.285 |
| 0.230 |
| 47.529 |
| 47.543 |
| 356.404 |
| 35406.822 |
| 46780.462 |
| 0.497 |
| 1.104 |
| 78.296 |
| 52.981 |
| 48.359 |
| 1146.304 |
| 3811.468 |
| 84580.690 |
| 157938.298 |
| 96335.140 |
| 0.549 |
| 0.549 |
| 0.231 |
| 0.231 |
|
| 1.000 |
| -21270001.00 |
| 1.000 |
| 1.000 |
| 1.000 |
| 0.000 |
| 1.000 |
| 1.000 |
| 12513.000 |
| 8705.000 |
| 1997.000 |
| 1.000 |
| 18.000 |
| 1.000 |
| 1.000 |
| 1.000 |
| 18.000 |
| 1.000 |
| 1.000 |
| 1.000 |
| 18.000 |
| 1.000 |
| 3.000 |
| 2003.000 |
| 0.009 |
| 0.314 |
| 0.016 |
| 0.053 |
| 1.295 |
| 1.017 |
| -3.989 |
| -3.989 |
| -3.989 |
| 0.987 |
| 0.987 |
| 0.987 |
| 3.000 |
| 1.000 |
| 1.000 |
| 1.000 |
| 1.000 |
| 1.000 |
| 1.000 |
| 1.000 |
| 1.000 |
| 1.000 |
| 35610.000 |
| 2.000 |
| 7.000 |
| 1.000 |
| 1.000 |
| 1.000 |
| 1.000 |
|
| 22.000 |
| 175540.000 |
| 10.000 |
| 4.000 |
| 2.000 |
| 98.000 |
| 2.000 |
| 2.000 |
| 20177.000 |
| 19520.000 |
| 2015.000 |
| 12.000 |
| 162.000 |
| 2.000 |
| 99.000 |
| 99.000 |
| 108.000 |
| 99.000 |
| 99.000 |
| 2.000 |
| 162.000 |
| 5.000 |
| 2063.000 |
| 2004.000 |
| 0.356 |
| 0.314 |
| 0.101 |
| 0.053 |
| 2.021 |
| 1.114 |
| 6.355 |
| 99.000 |
| 99.000 |
| 2.784 |
| 99.000 |
| 99.000 |
| 2063.000 |
| 125121.000 |
| 164439.000 |
| 2.000 |
| 4.000 |
| 229.000 |
| 249.000 |
| 201.000 |
| 4010.000 |
| 13645.000 |
| 347464.000 |
| 349516.000 |
| 347857.000 |
| 4.000 |
| 4.000 |
| 2.000 |
| 2.000 |
|